These are mostly my notes from reading of information theory section from Machine Learning : A Probabilistic Perspective.
Entropy: Entropy is the measurement of "uncertainity" in a random variable X. And, is given by

To gain some intuition, let us consider the Bernoulli random variable.
P(X = 1) = p
P(X = 0) = 1-p
H(X) = - P(1)Log(P(1)) - P(0)Log(P(0))
H(X) = - pLog(p) - (1-p)Log(1-p) [also called binary entropy function]
Here is what it's graph looks like(taken from book)..

It is clear that entropy aka uncertainty is maximum when p = 0.5 (or the distribution is uniform in general), which is in agreement with intuition that you are in no position to guess an event when the probability of it happening is exactly same as each other event in consideration.
Also, negative of entropy is called "Information" which is in some sense an opposite of "uncertainty".
KL Divergence: It is a measure of divergence or "dissimilarity" between two probability distributions, say p and q. And, is given by

It can be proved that KL is always greater than or equal to 0. And, KL = 0 iff p = q.
Clearly, higher the KL divergence implies higher dissimilarity between two probability distributions.
Mutual Information(MI): Mutual information is a measure of degree of "correlation" between two random variables X and Y. It is obtained by finding the dissimilarity between P(X,Y) and P(X)P(Y), which is KL divergence.
So, MI, I(X,Y) = KL(P(X,Y) || P(X)P(Y))

I(X,Y) = 0 means X and Y are essentially the same and higher MI means higher dissimilarity and hence higher correlation.
It can be easily derived that
I(X,Y) = H(X) - H(X|Y) = H(Y) - H(Y|X)
where H(X|Y) is "conditional entropy" of X given Y, and is given by

H(X|Y) can be interpreted as uncertainty in X after observing Y. So
I(X,Y) = H(X) - H(X|Y) gives us another interpretation of MI, that is, reduction in uncertainty of X after observing Y.
Another question is that why Pearson's correlation coefficient is not a good enough measurement of correlation. It turns out that correlation coefficient fails terribly on capturing many kind of relationships as is evident in following figure (taken from wikipedia)
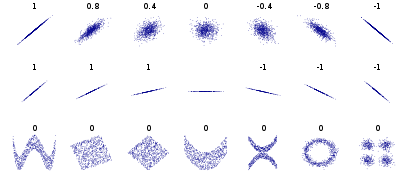
Fig: Several sets of (x, y) points, with the correlation coefficient of x and y for each set. Note that the correlation reflects the non-linearity and direction of a linear relationship (top row), but not the slope of that relationship (middle), nor many aspects of nonlinear relationships (bottom).
Entropy: Entropy is the measurement of "uncertainity" in a random variable X. And, is given by
To gain some intuition, let us consider the Bernoulli random variable.
P(X = 1) = p
P(X = 0) = 1-p
H(X) = - P(1)Log(P(1)) - P(0)Log(P(0))
H(X) = - pLog(p) - (1-p)Log(1-p) [also called binary entropy function]
Here is what it's graph looks like(taken from book)..

It is clear that entropy aka uncertainty is maximum when p = 0.5 (or the distribution is uniform in general), which is in agreement with intuition that you are in no position to guess an event when the probability of it happening is exactly same as each other event in consideration.
Also, negative of entropy is called "Information" which is in some sense an opposite of "uncertainty".
KL Divergence: It is a measure of divergence or "dissimilarity" between two probability distributions, say p and q. And, is given by
It can be proved that KL is always greater than or equal to 0. And, KL = 0 iff p = q.
Clearly, higher the KL divergence implies higher dissimilarity between two probability distributions.
Mutual Information(MI): Mutual information is a measure of degree of "correlation" between two random variables X and Y. It is obtained by finding the dissimilarity between P(X,Y) and P(X)P(Y), which is KL divergence.
So, MI, I(X,Y) = KL(P(X,Y) || P(X)P(Y))
I(X,Y) = 0 means X and Y are essentially the same and higher MI means higher dissimilarity and hence higher correlation.
It can be easily derived that
I(X,Y) = H(X) - H(X|Y) = H(Y) - H(Y|X)
where H(X|Y) is "conditional entropy" of X given Y, and is given by
H(X|Y) can be interpreted as uncertainty in X after observing Y. So
I(X,Y) = H(X) - H(X|Y) gives us another interpretation of MI, that is, reduction in uncertainty of X after observing Y.
Another question is that why Pearson's correlation coefficient is not a good enough measurement of correlation. It turns out that correlation coefficient fails terribly on capturing many kind of relationships as is evident in following figure (taken from wikipedia)
Fig: Several sets of (x, y) points, with the correlation coefficient of x and y for each set. Note that the correlation reflects the non-linearity and direction of a linear relationship (top row), but not the slope of that relationship (middle), nor many aspects of nonlinear relationships (bottom).

No comments:
Post a Comment